“Oh shit, I think I just changed my mind.” -Student
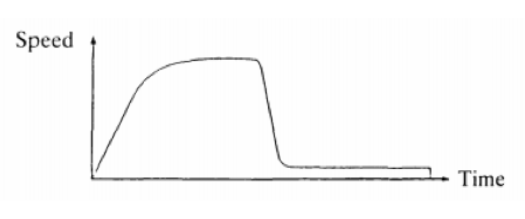
Today in class we talked about the above graph. For 45 minutes. One graph. And almost every single one of my students was engaged the entire time. Here’s what happened…
During the summer I attended an institute at Boston University on facilitating productive math conversations. We learned how to set up norms for math talk and how to use talk moves (student and teacher ones) to help us facilitate the conversation. Luckily, I attended this institute with a fantastic colleague, and we have been able to share strategies as we start to implement more math talk in our classrooms. My colleague has used the original graph for years, but now it’s more clear what we want the students to talk about and how we want them to do it.
Student goals for this lesson:
• Describe the behavior of the function using precise mathematical vocabulary
• Make a choice about the sport that can best be modeled by the given graph
• Defend their own choice and respectfully critique the choice of others if they do not agree
• Reconsider their choice if they have not taken into account the time that elapses in each section of the graph
Teacher goals for this lesson:
• Use the talk moves
• Stay neutral – don’t pick a sport to keep the kids wondering
• Say very little
I started the lesson by projecting the ambiguous graph on the front board:
I asked students to “Turn and talk” with their partner about the behavior of the graph. Essentially, what is happening here? I asked volunteers to share with the class. Some pairs made up their own stories. We heard about objects, cars, runners, and animals. They were accelerating, then something happened to cause the speed to change quickly. Then “object” returned to a constant speed and stopped abruptly. There was a great debate over the vertical line at the end of the graph, with many students sharing that an object cannot have more than one speed at one moment in time. Misconceptions became clear as some students referred to the distance of the object from the starting point. Some thought the object stopped and turned around. Students jumped in to clarify. We didn’t move on until everyone understood the difference between a distance/time graph vs. speed/time graph.
Then, I threw this slide at them:
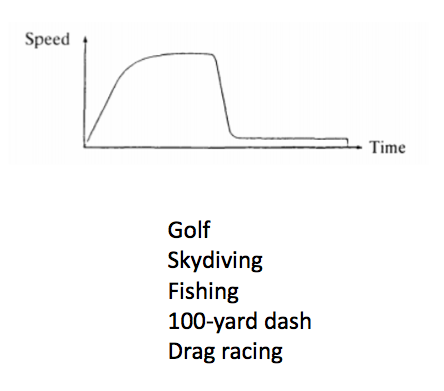
Without talking, students were told to choose the sport they believe is best modeled by the graph. Convince me, I said. Students wrote their responses on this interview grid, then swapped ideas by interviewing two other students (See this post for more on the interview grid strategy).
By this point, students could barely keep their ideas inside anymore. Sharing with only two classmates was not good enough; they wanted, needed, to discuss their ideas with the whole class. I asked for one volunteer to start off. It was really hard to choose. And then they talked. I didn’t say much, just kept the conversation going by calling on students and using some of the talk moves. My above mentioned colleague observed one my lessons and wrote down some of the phrases I used to keep it going:
-Say more about ________
-Can someone rephrase what ________ said?
-Can someone add-on to what ________ said?
-Does anyone agree or disagree? Why?
-Are you changing your mind? Why?
I barely talked about the actual characteristics/behavior of the graph, because I didn’t have to. If a student said something incorrect, another student shared his thoughts to help clarify. Some students came up to the board to draw additional graphs to support their thinking. The students led the conversation and I just went with it. The goals above were always on my mind, and eventually we met them in each class.
So what did the students say? I didn’t write anything down because I wanted to give my full attention to the conversation. Here is a snapshot of their interview grids:


The student work is a great representation of the different ideas discussed during our conversation. Many students stuck with their original sport, but many were influenced by the thoughts of their peers and changed their minds. Students wanted to know what is the right sport, but, there isn’t only one right answer I told them. Many students came to this conclusion on their own as well. If we had more time, I would’ve asked students if they could think of another sport that could be modeled by this graph.
We will follow up this activity with the Desmos Function Carnival. I think students are really going to like this unit.
Update: The “Which Sport?” graph was originally published in the The Language of Functions and Graphs by Malcolm Swan.
